Better understanding of spreading in a heterogeneous soil

Highlights
- Better understanding of dispersion in very heterogeneous soil
- Large vertical variation of the flux at short distance
- Quantification of the pollutant load in the different soil layers
- Validation study of the flux measurements
Situation
Chlorinated solvents (CVOC)
Source: Industrial production site
Partners: éOde, OFEV, Canton of Jura, Geotechnical Institute, Ineris
Location: Jura, Switzerland
The site is located in the canton of Jura, Switzerland. It is an old production site of 6500m² with a long industrial history. This industrial past has lead to contamination with chlorinated solvents which needs to be remediated.
In addition to traditional concentration measurements, iFLUX measurements were performed in the beginning of 2020 to better understand the dynamics of the groundwater and contamination at this very heterogeneous site. The study also tested the applicability of iFLUX measurements in the field and described the possibilities and scope of the measurements. The report of this validation study is available on the website of the Swiss administration (https://www.bafu.admin.ch/bafu/fr/home/themes/sites-contamines/publications-etudes/etudes.html).
Additional microbiological analyses were performed by éOde to determine the degradation potential.
The subsoil is very heterogeneous, with alluvium under the cover layer, made up of gravel, sand and silt, and below a package of silty sand resting on an aquitard made up of molasses. The molasse is locally slightly to strongly altered at the limit with the silty sand. The water table is located at a depth of about 3 m and the low permeability molasse at a depth of about 10 m.
Sampling
A total of 31 iFLUX samplers consisting of one cartridge for measuring water flux and another for determining CVOC mass flux were installed at 18 locations. The monitoring wells are located along three transects perpendicular to the expected flow direction (BB', CC' and DD') and one transect parallel to the flow direction (EE').
Samplers were installed on the 14th of January 2020 and retrieved on the 11th of February 2020. The exposure time, determined based on available concentration data and geohydrological characteristics, was 28 days.

Figure 1: Site map showing the source areas, monitoring wells and transects where the iFLUX samplers have been installed. ©eOde

"The use of iFLUX samplers has provided a better understanding of how the contamination was spreading and the large differences in depth profile due to the contrasting hydrogeological setting. In addition, the iFLUX samplers are convenient and easy to install."

Challenges
Unknown spreading and degradation potential
- Very heterogeneous soil structure
- Sources and nuclei of contamination not precisely known, given the history of the site
- Spreading and degradation potential of the contamination unknown
Solutions
Flux measurements to better understand the underground dynamics
- Flux measurements (water and contaminants) to identify source areas
- Measurements at different depths and distances to identify preferential flow paths
- Determination of contaminant fluxes and degradation products in groundwater to obtain a better understanding of the degradation potential of the contamination. Analysis of microbiology in parallel
Results

Flow velocity
Measured groundwater velocity ranged from 15 to 107 cm/day. The highest velocity was measured in the alluvial deposits (average of 72 cm/day) compared to a slightly lower velocity in the silty sand formation underlain by the more or less weathered molasse (average of 38 cm/day).
Velocities and mass fluxes can vary vertically over short distances.
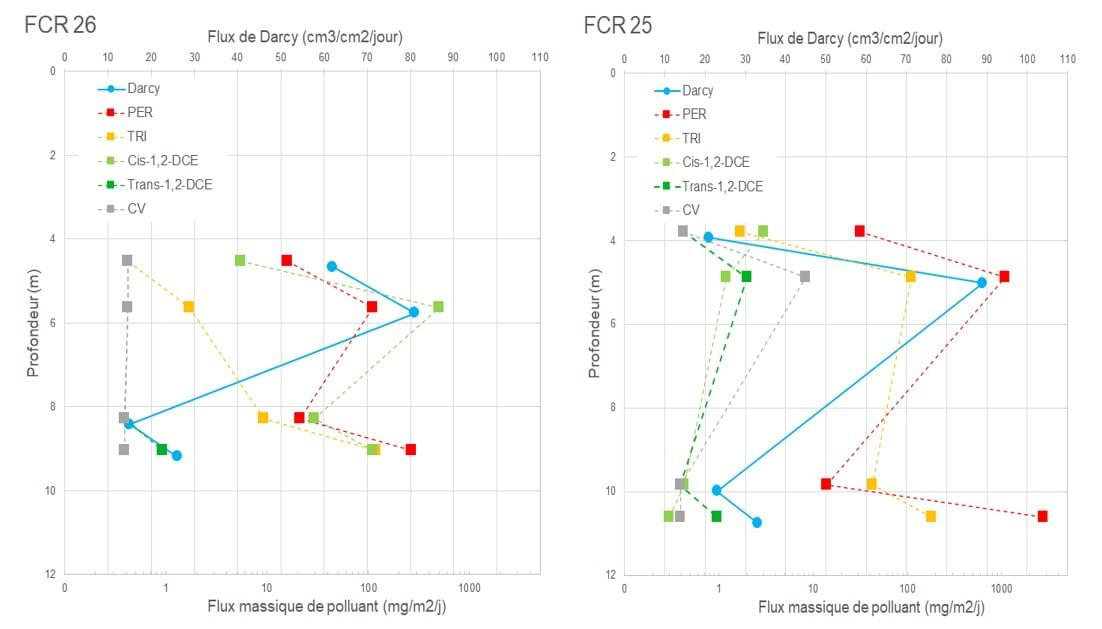
Figure 2: Vertical profile showing flow velocities (Darcy flow) and mass flow in FCR26 and FCR 25, both located near the CC' transect.
Mass flux
The sum of CVOC fluxes measured in the different cartridges varied greatly, i.e. from 8 to 6211 mg/m²/day. Overall, higher fluxes were found with PCE. This sinks and spreads into the deeper formation with the silty sand lying on the weathered molasse. Fluxes of degradation products were detected downstream, but to a lesser extent than the PCE Degradation products are found primarily in the alluvial deposits and, to a lesser extent, in the underlying formation with silty sand and weathered molasse. The high mass flux in transect CC' indicates the presence of an additional source area between transects BB' and CC'. Locally (FCR 26), a high mass flux to be related to low water flow velocity was measured. This could indicate the presence of DNAPL.

Figure 3: Site map with indication of the measured mass flow
Charge polluante
The pollutant load across the transects was determined by statistical interpolation of the flow data (performed by éOde). Areas with a high pollutant load were clearly identified. The total CVOC load in the lower formation with silty sands is only slightly higher than that in the alluvial deposits. This contrasts with the overall lower measured flow velocities in the deeper formation. This indicates the local presence of contamination accumulation zones and the possible presence of (secondary) source areas.